A few points. I mentioned before a possible bug in root. I think I've diagnosed it as an extremely inefficient copy constructor. Because my code utilizes so many copies of so many 4-vectors it runs extremely slow. Instead of waiting hours for each run I decided to do use one dimensional histograms instead of two (I'll work this out later). Also I wrestled for hours on end today trying to figure out why my equations weren't working and it turned out to be because I wasn't using the (+,-,-,-) scalar product convention. So because of the slowness of the code and the exhaustion from wrestling with this pseudo-problem I only managed produce two plots. I'll try to find a way to make this more efficient later by maybe writing my own functions and tomorrow I'll work on producing more plots to verify this result. Onto the plots.
The masses are as follows:
m_1 = 160 GeV
m_2 = 80 GeV
m_3 = 40 GeV
m_4 = 0.0001 GeV
m_A = 0.1 GeV
m_B = 0.1 GeV
m_C = 0.1 GeV
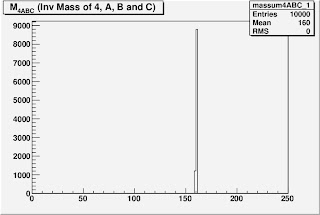
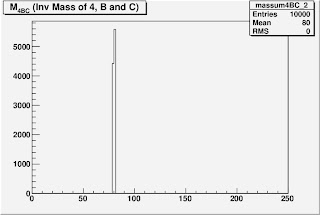
These are one dimensional distributions on the reconstructed value of m_1 using the method you prescribed.
When I guessed the wrong value m_2 = 16 GeV this was the distribution:
When I guessed the correct value of m_2 = 80 GeV this was the distribution:

Looks somewhat promising doesn't it?
**UPDATE**
This is an insomnia induced 2-D histogram. I stripped down the code to output the bare minimum information and got it to run fast enough to produce this.
Y-Axis: Reconstruction of m_1
X-Axis: Guesses on the value of m_2
Result: Bowtie with a knot at (m_2 = 80, m_1 = 160). Beautiful.
Y-Axis: Reconstruction of m_1
X-Axis: Guesses on the value of m_2
Result: Bowtie with a knot at (m_2 = 80, m_1 = 160). Beautiful.


