Thursday, February 12, 2009
Wednesday, February 4, 2009


Wednesday, January 28, 2009
Maybe Something? -> Yes Success
I thought about the mass reconstruction again and decided to rescind the statement that I agree it is impossible. I came across some lines of reasoning as to why it still might work so I decided to give it a shot. I figured even if it didn't work, it would still be a good exercise to complete the project that I had started.
A few points. I mentioned before a possible bug in root. I think I've diagnosed it as an extremely inefficient copy constructor. Because my code utilizes so many copies of so many 4-vectors it runs extremely slow. Instead of waiting hours for each run I decided to do use one dimensional histograms instead of two (I'll work this out later). Also I wrestled for hours on end today trying to figure out why my equations weren't working and it turned out to be because I wasn't using the (+,-,-,-) scalar product convention. So because of the slowness of the code and the exhaustion from wrestling with this pseudo-problem I only managed produce two plots. I'll try to find a way to make this more efficient later by maybe writing my own functions and tomorrow I'll work on producing more plots to verify this result. Onto the plots.

The masses are as follows:
m_1 = 160 GeV
m_2 = 80 GeV
m_3 = 40 GeV
m_4 = 0.0001 GeV
m_A = 0.1 GeV
m_B = 0.1 GeV
m_C = 0.1 GeV
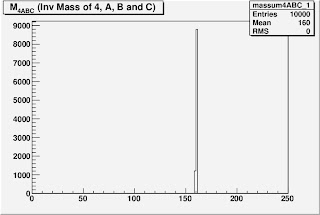
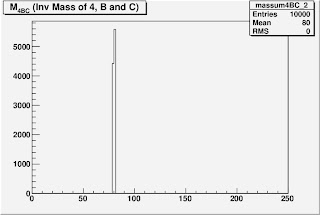
These are one dimensional distributions on the reconstructed value of m_1 using the method you prescribed.
When I guessed the wrong value m_2 = 16 GeV this was the distribution:

When I guessed the correct value of m_2 = 80 GeV this was the distribution:

A few points. I mentioned before a possible bug in root. I think I've diagnosed it as an extremely inefficient copy constructor. Because my code utilizes so many copies of so many 4-vectors it runs extremely slow. Instead of waiting hours for each run I decided to do use one dimensional histograms instead of two (I'll work this out later). Also I wrestled for hours on end today trying to figure out why my equations weren't working and it turned out to be because I wasn't using the (+,-,-,-) scalar product convention. So because of the slowness of the code and the exhaustion from wrestling with this pseudo-problem I only managed produce two plots. I'll try to find a way to make this more efficient later by maybe writing my own functions and tomorrow I'll work on producing more plots to verify this result. Onto the plots.

The masses are as follows:
m_1 = 160 GeV
m_2 = 80 GeV
m_3 = 40 GeV
m_4 = 0.0001 GeV
m_A = 0.1 GeV
m_B = 0.1 GeV
m_C = 0.1 GeV
These are one dimensional distributions on the reconstructed value of m_1 using the method you prescribed.
When I guessed the wrong value m_2 = 16 GeV this was the distribution:

When I guessed the correct value of m_2 = 80 GeV this was the distribution:

Looks somewhat promising doesn't it?
**UPDATE**
This is an insomnia induced 2-D histogram. I stripped down the code to output the bare minimum information and got it to run fast enough to produce this.
Y-Axis: Reconstruction of m_1
X-Axis: Guesses on the value of m_2
Result: Bowtie with a knot at (m_2 = 80, m_1 = 160). Beautiful.

Y-Axis: Reconstruction of m_1
X-Axis: Guesses on the value of m_2
Result: Bowtie with a knot at (m_2 = 80, m_1 = 160). Beautiful.

Friday, January 23, 2009
Full Workup of New Code
I thought the old naming convention for particles 1-4 was awkward so I changed it. The numbers now go up as we go down the cascade chain:
To test the code I assigned the following masses to the particles in order to simulate a generic four body SUSY decay with massless LSP:
Particle 1: Mass - 160 GeV
Particle 2: Mass - 80 GeV
Particle 3: Mass - 40 GeV
Particle 4: Mass - 0.1GeV
Particle A: Mass - 0.1 GeV
Particle B: Mass - 0.1 GeV
Particle C: Mass - 0.1 GeV
I created the following diagnostic plots over 10,000 "events":
Two Triangle Graphs (Endpoints expected at 120 GeV and 69.3 GeV):


Three Ways to Construct Mass Peak of Particle 1 (160 GeV)


Two Ways to Construct Mass Peak of Particle 2 (80 GeV)

One Way to Construct Mass Peak of Particle 3 (40 GeV)

To test the code I assigned the following masses to the particles in order to simulate a generic four body SUSY decay with massless LSP:
Particle 1: Mass - 160 GeV
Particle 2: Mass - 80 GeV
Particle 3: Mass - 40 GeV
Particle 4: Mass - 0.1GeV
Particle A: Mass - 0.1 GeV
Particle B: Mass - 0.1 GeV
Particle C: Mass - 0.1 GeV
I created the following diagnostic plots over 10,000 "events":
Two Triangle Graphs (Endpoints expected at 120 GeV and 69.3 GeV):


Three Ways to Construct Mass Peak of Particle 1 (160 GeV)


Two Ways to Construct Mass Peak of Particle 2 (80 GeV)


One Way to Construct Mass Peak of Particle 3 (40 GeV)

All things suggest that the code is working perfectly. I expect to make some progress recreating the mass of particle 1 in the manner suggested by you this weekend. I will give you an update on Monday.
Thursday, January 22, 2009
New Code
The new code is just about finished. There are some kinks that I have yet to work out but I will document my progress here. The decay chain I am recreating is this one:


I put in the following values for the masses into the code in an attempt to recreate the parameters of MLB:
Particle 4: Mass = 170 GeV
Particle 3: Mass = 80 GeV
Particle 2: Mass = 0.0001 GeV
Particle A: Mass = 0.1 GeV
Particle B: Mass = 0.1GeV
To test the code I calculated the invariant mass of 2+A+B to make sure that it came out to 170 GeV as it should:

Pretty much spherically symmetric. Currently continuing the investigating on why the code isn't giving my triangles.
Particle 4: Mass = 170 GeV
Particle 3: Mass = 80 GeV
Particle 2: Mass = 0.0001 GeV
Particle A: Mass = 0.1 GeV
Particle B: Mass = 0.1GeV
To test the code I calculated the invariant mass of 2+A+B to make sure that it came out to 170 GeV as it should:

So I know the mass formulae that I derived for the 4-vectors are correct. Next I tried to make some triangles using the invariant mass of A+B:


Not quite a triangle unfortunately. The end point is in the correct place and I ran the code again using only 180 degree decay angles and it gave a single peak at 150 GeV. So at least I can be 100% confident that the Lorentz boost function is working properly.
I thought maybe there is a problem with the random number generator so I plotted the Theta/Phi distribution of 2 and B in the rest frame of 3:

I thought maybe there is a problem with the random number generator so I plotted the Theta/Phi distribution of 2 and B in the rest frame of 3:

Thursday, September 4, 2008
Hyperbolic Projections
Mjl vs. Mjll' Mjl' vs. Mjll'
Mjl vs. Mjll' Mjl' vs. Mjll'


Mjll' Projected Hyperbola 1 Mjll' Projected Hyperbola 2


Mjl vs. C Mjl' vs. C


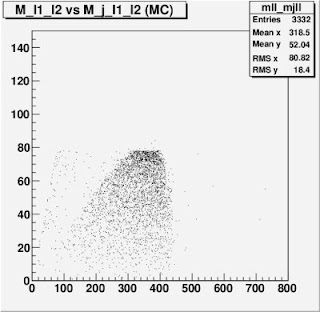
Mjl/Mjl' vs. Mjll


Tuesday, September 2, 2008
Non-rectilinear Binning
Below are plots in which I utilized a calculation of the non linear right hand edges to bin one dimensional projections of these scatter plots onto the x-axis. The calculation used seems incomplete because it approximates the first two quite well but does not seem to reflect the shape of the oddly shaped third scatter plot.


Edge at 300 as expected Edge at 400 as expected

Calculation does not match scatter plot

Edge at 300 as expected Edge at 400 as expected


Calculation does not match scatter plot

Subscribe to:
Posts (Atom)